Reports
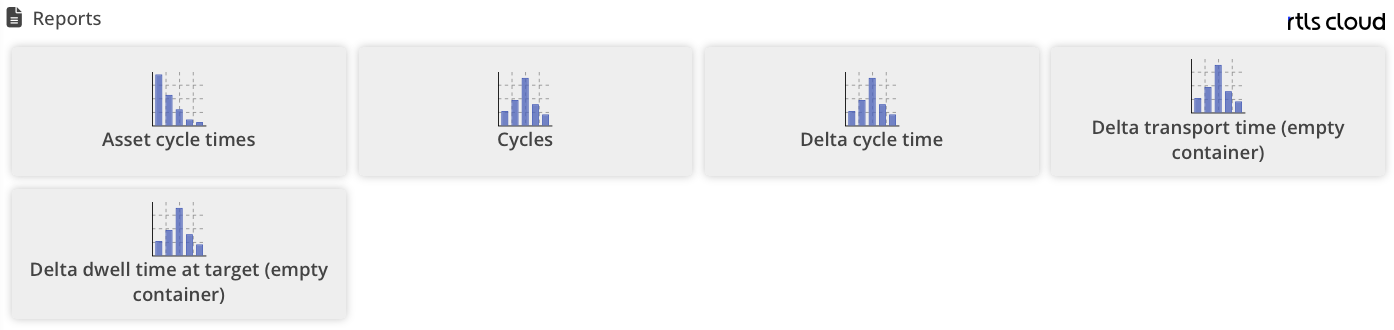
Each report is opened through its tile. Resting the pointer on a tile shows the same short description that the table below carries.
Some of the reports are computed from route data: they only see assets running on a route. Where that applies, the description says so and the report itself states it at the top.
|
Reports always relate to the selected space. If a tag is assigned to an asset in two application spaces, two separate tracks are created — the same tag can legitimately matter to two use cases. Per-tag figures therefore cannot be added up across application spaces; whoever evaluates across spaces filters by space. See Space type and infrastructure space. |
Reference
| Name | Description |
|---|---|
Asset lead times |
How long the assets take to complete a cycle, corrected for non-working time from the operations calendar. Per asset type, over the period selected. |
Cycles |
How many cycles the assets have completed, as a distribution per asset type with its mean and median. |
Delta of cycle days to target cycle days |
By how many days the cycles run over their target cycle time, as a histogram. A click on a bar lists the tracks behind it. |
Delta of transport lead time (empties) |
By how many days the empties take longer to reach the target than planned, as a histogram over the tracks. |
Delta of idle time at supplier (empties) |
By how many days the empties stand at the supplier beyond the expected departure, as a histogram over the tracks. |
Heatmap |
Where the tracking events occur, drawn on the map as a density – the busy areas of the site. |
Silent assets |
How many assets have not reported for how long. Covers assets without a route as well, unlike the reports below. |
Locations by asset stock |
How many assets stand where right now, per location and broken down by asset type. A click on a bar lists them. |
Location dwell times |
How long the assets stand at each location – minimum, median, mean and maximum, ranked by median. Based on route data. |
Movement matrix |
Which locations the assets move between, and how often. Based on route data. |
Activity profile |
At which times of day and on which weekdays the assets arrive somewhere – and whether that matches the operations calendar. Based on route data. |
Grouping locations
In Locations by asset stock and Location dwell times, not every single location is reported on its own. Locations are grouped through the POIs: a location without a POI of its own is counted towards the nearest POI above it.
A site with its areas for empties and full goods therefore appears as one row, while works that each carry a POI of their own stay apart. A location with no POI anywhere above it is shown under its own name.
Which locations are grouped together thus follows from how the POIs are maintained, and can be steered there.